DT series program is available in five different configurations; each one tailed to meet the workload of the lab.
DT-M: motorized control version for all metallurgical applications
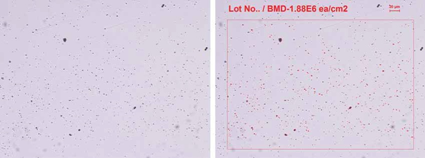
DT-PA: focusing on automatic filter contamination analysis based on industry standards
DT-PAG: focusing on automatic nodularity analysis
DT: general metallurgical applications
DT-L: streamlined version of DT
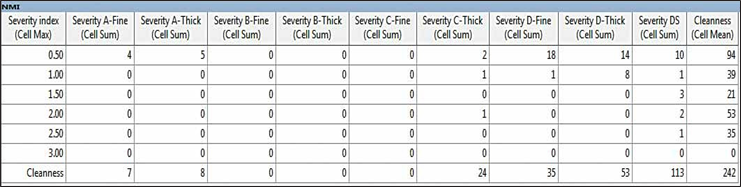
Non-metallic Inclusion Rating
Extreme value analysis of Non-Metal Inclusions (NMI)-ASTM E2283
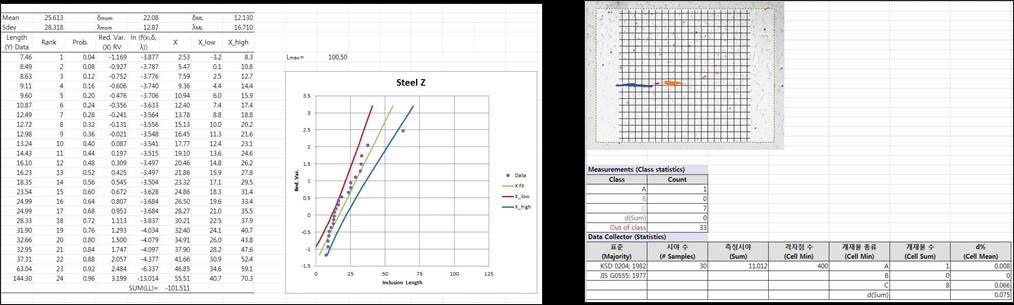
- The iSolution DT software program constantly endeavors to provide the most complete set of tools for metal texture analysis. As a result, the analysis solution to non-metallic inclusion is unveiled. This function is intended to determine the inclusion content of steel according to EN 10247 (2007), ASTM E2283, ASTM E45 (2002), E1122, E1245-03 (2008), DIN 50602 (1985), ISO 4967(1998), KSD 0204 (2002), KSD 0204(1982), JIS G0555 (1977), JISG 0555 (2003).
- There are two analysis approaches implemented, Stereological measurements and JK inclusions ratings. The European and British Standard BS EN 10247 (2007) has been added. This is the micrographic examination of the non-metallic inclusion content of steels using standard reference pictures. This European Standard defines a method of microscopic non-metallic inclusion assessment using reference charts. The basic principle of this European Standard allows the determination of non-metallic inclusion content by image analysis techniques. According to the CEN/CENELEC Internal Regulations, the national standards organizations of the following countries are bound to implement this European Standard: Austria, Belgium, Bulgaria, Cyprus, Czech Republic, Denmark, Estonia, Finland, France, Germany, Greece, Hungary, Iceland, Ireland, Italy, Latvia, Lithuania, Luxembourg, Malta, Netherlands, Norway, Poland, Portugal, Romania, Slovakia, Slovenia, Spain, Sweden, Switzerland and United Kingdom.
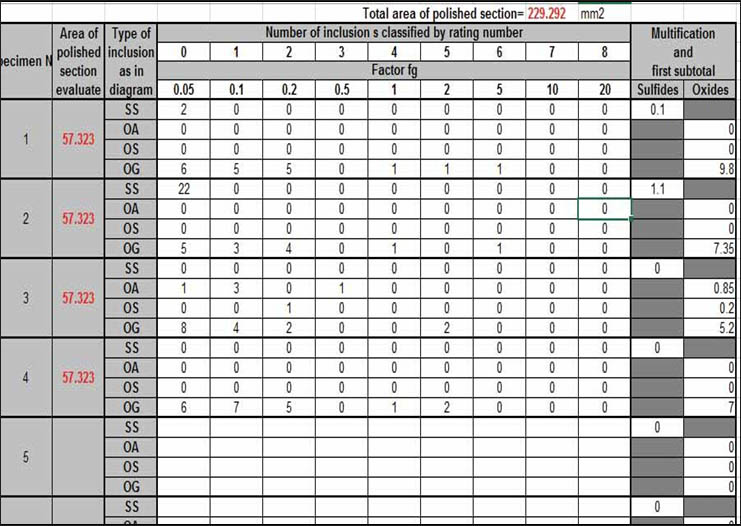
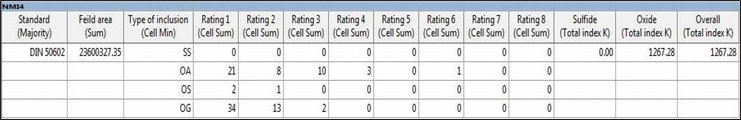
DIN 50602 |
ISO 4967 |
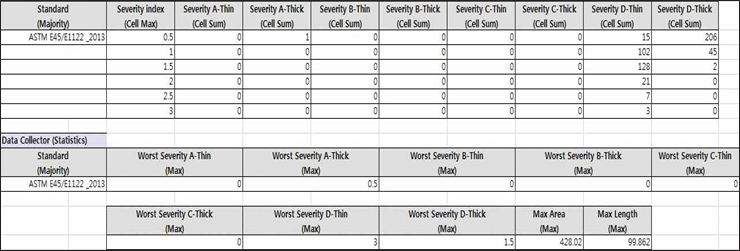
ASTM E45 |
Customized Particle Analysis
- Analysis can be applied to one complete image or within a selected field of interest (FOI). Annotations such as text and scale bar can be added to the image for more detail.
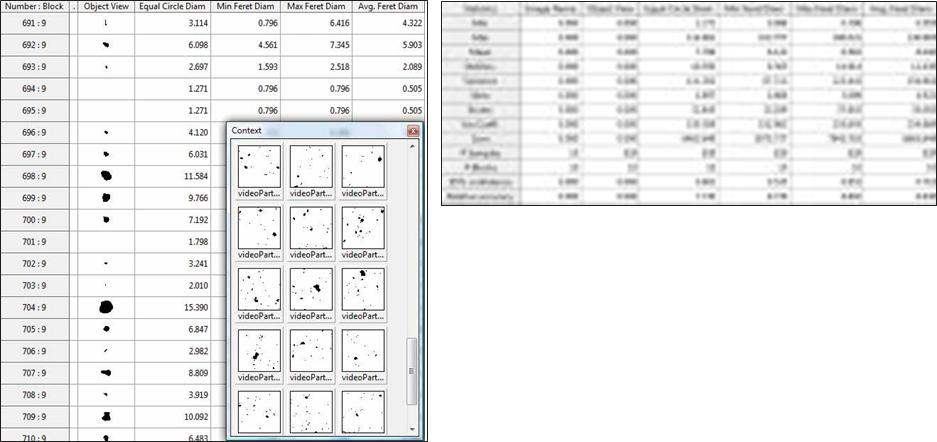
Particle Shape and Size Analysis
- Particles over several images are characterized on the basis of shape and size. Customized parameters for selecting and sorting the data are available, producing volume distribution and other statistics.
The Particle Gallery showing each object's shape in each classification range is displayed in the data collector table. All resulting data as well as the Particle Gallery can be exported to MS Excel by a simple mouse click.
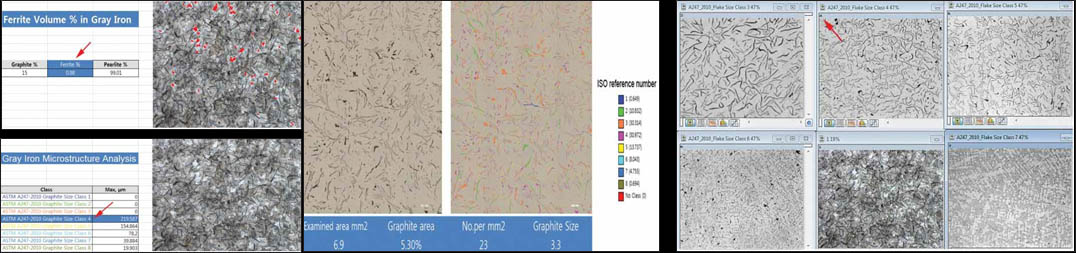
Microstructure of Cast Irons (by image analysis software)
Microstructure of Cast Irons According to ISO/TR 945-2:2011
- iSolution DT provides shape, size, graphite types, nodularity and distribution of graphite inclusions in cast iron according to international standards such as ASTM A247_2010, ASTM A247-67 (1998), ISO/TR 945-2: 2011, ISO16112: 2006 , JIS G5502 (2001), KSD 4302 (2002).
- Cast iron analysis considers several consequent image-frames processed to achieve improved statistical results. The results are
accumulated in a special data collector document. An Excel file may be created to report the results.
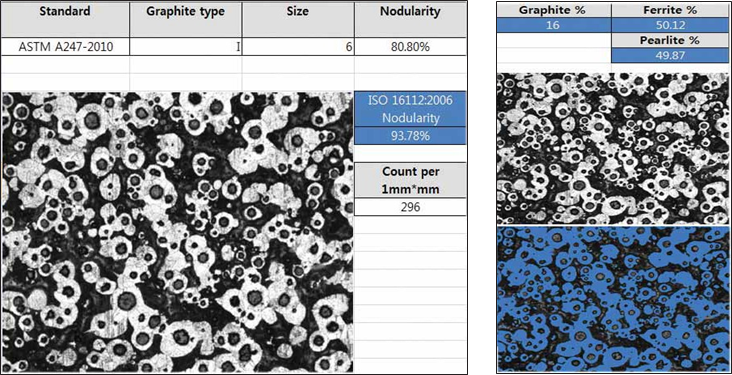
- The real nodularity analysis based on standard Nodularity is calculated by Graphite types. ISO/TR 945-2: 2011 describes procedures using image analysis software for graphite classification.
- ISO16112: 2006 defines a method of compacted (vermicular) graphite cast iron nodularity evaluation.
- In ISO 16112:2006, percent nodularity is calculated and weighted based on roundness-shape factor and graphite form. Reference images provided in Chart Navigator (see below) include Nodule Size Class, Flake Size Class, Graphite Form, and Distribution Examples.
CGI (Compacted Graphite Iron) Microstructure Analysis
The measurement tool window has clearly defined buttons for controlling manual and automated microscope functions. Precision control of various tools and lighting control are micro-adjustable using the keyboard.
DAS (Dendrite Arm Spacing), ARP1947-2007/08
- This procedure is for determining the acceptability of the dendrite arm spacing (DAS) of D357-T6 aluminum alloy castings that have a specified tensile strength. Dendrite arm spacing (DAS) refers to the spacing between the secondary arms of the dendrite structure.
- Based on the ARP1947-2007/8 standard, a straight line is drawn perpendicularly to the growth direction of the secondary arms. Each space is then measured automatically.
- Average, Min, Max, and Standard Deviation measurement values are generated automatically.
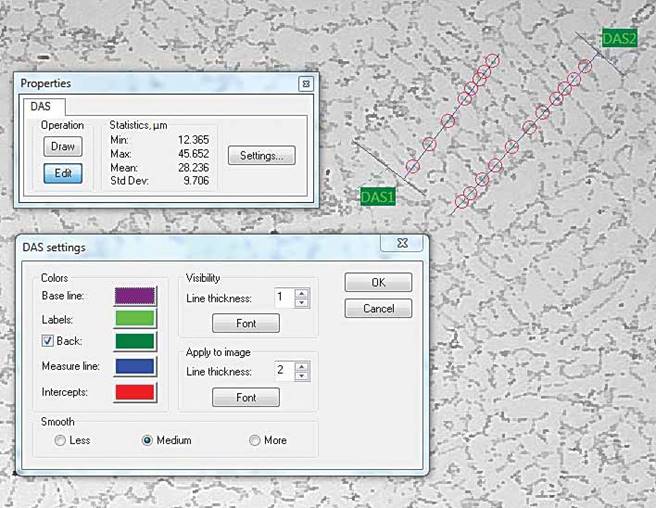
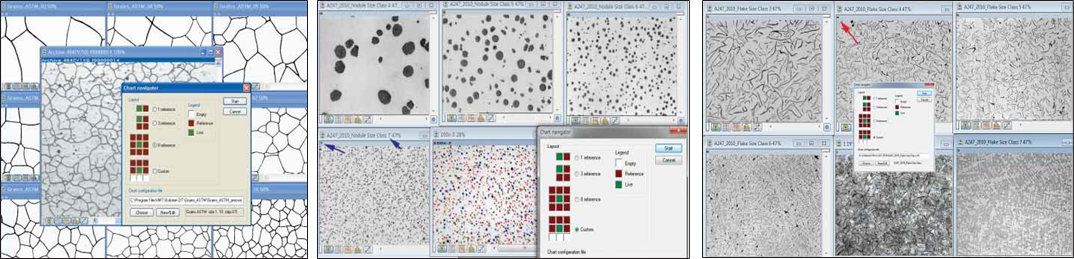
Chart Navigator
- The Chart Navigator permits direct comparison between either live or captured images with a series of reference images.
- The user-friendly interface allows you to quickly select the appropriate reference image which most closely matches the live or
captured image. Both the live image and the reference image can be exported to MS Excel by a sigle mouse click.
- The Synchronize Zoom function maintains the magnification relationship between the reference image(s) and the live or captured image when using the image Zoom tool.
- Included reference images are: ASTM A247_2010 Distribution, ASTM A247_2010 Flake Size Class, ASTM A247_2010 Graphite Form, ASTM A247_2010 Nodule Size Class, ASTM A-247, Grain ASTM, Twin Grain ASTM, ISO TR 945-2_2011 Graphite Form, Sinter Cast CGI
(Compacted Graphite Iron).
Grain Size Measurement
ASTM E112
(2012), ASTM E1382, ISO 643 (2012), KSD 0205
- iSolution DT provides the standard measurement environment for structural analysis of metal and materials. ASTM E112 (2000).
- ASTM E1382 (2010) describe the Grain Size measurement environment with both various Line Intercept methods as well as
Planimetric counting methods. The ASTM E1382 (2010) standard defines methods for determining grain size when using image
analysis software.
- Due to accurate Edge Detect algorithms, iSolution DT provides both automatic and manual measurement environments. Grain size statistics as well as images with grain sized data and images with grain overlays are generated. Grains touching image boundaries are automatically ignored based on the standard.
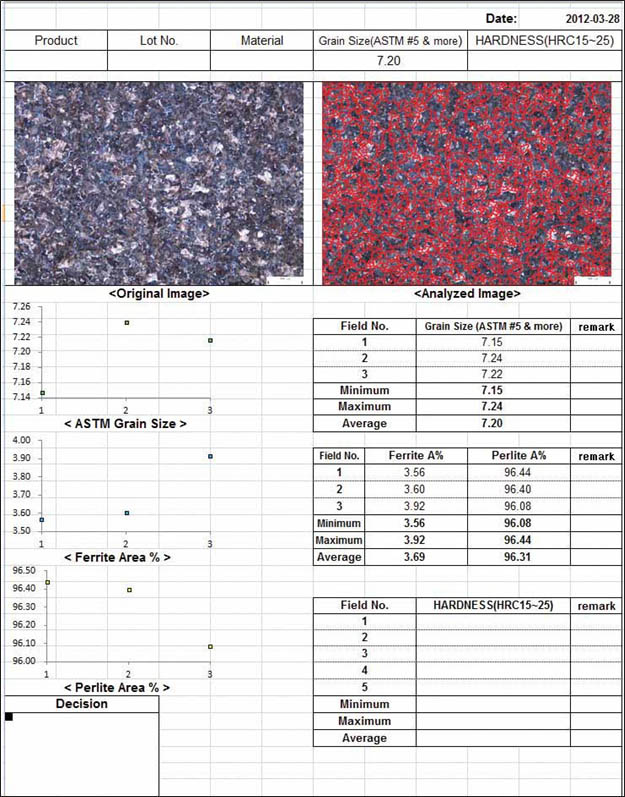
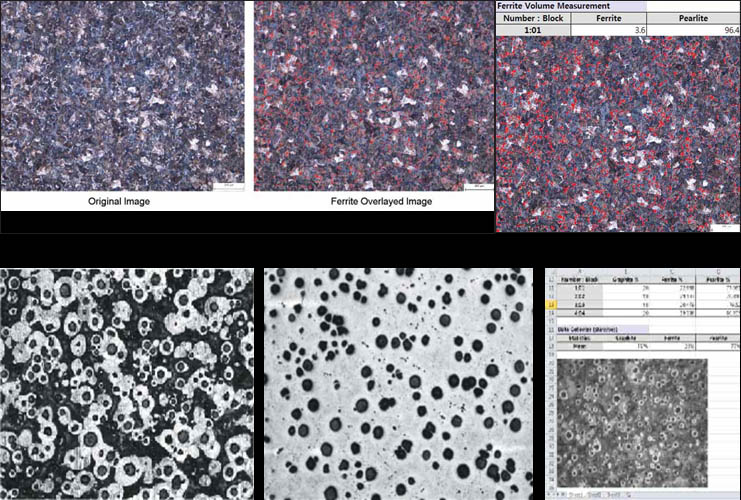
Ferrite Volume Measurement
- Percentage of Ferrite area can be calculated excluding the graphite area automatically. As such, percentage of Ferrite, Pearlite, and
Graphite areas can be acquired very easily. One single mouse click of the Ferrite volume measurement produces the results (below).
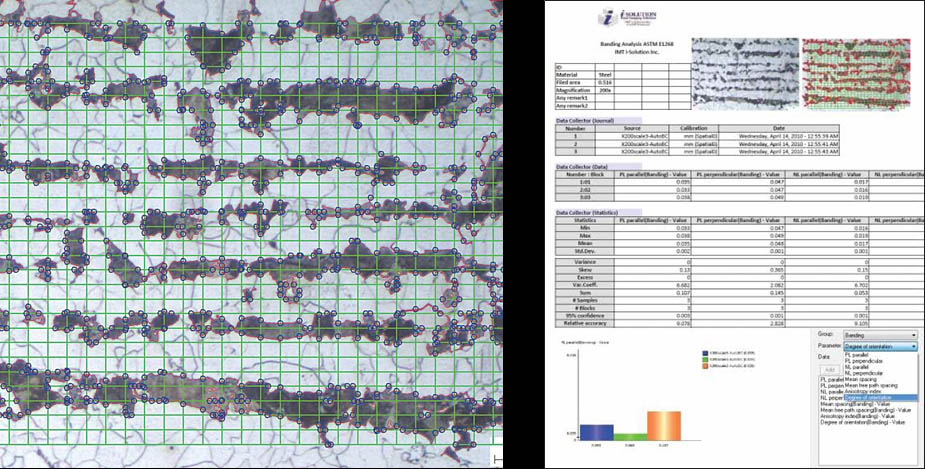
Assessing the Degree of Banding or Orientation of Microstructures by ASTM E 1268
- ASTM1268 Banding Analysis Assessing the Degree of Banding or Orientation of Microstructures by ASTM E 1268 Segregation
occurs during the dendritic solidification of metals and alloys and is aligned by subsequent deformation. Solid-state
transformations may be influenced by the resulting micro-segregation pattern leading to development of a layered or banded
microstructure. The below parameters are used for the ASTM1268 Banding Analysis
- Anisotropy index (Banding) value
- NL parallel (Banding) value
- NL perpendicular (Banding) value
- PL parallel (Banding) value
- PL perpendicular (Banding) value
- Degree of Orientation (Banding) value
- Mean spacing (Banding) value
- Mean free path spacing (Banding) value
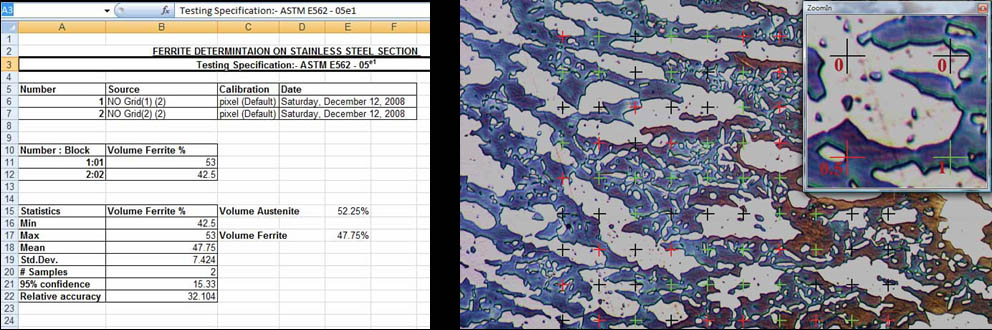
Volume Fraction by systematic manual point count (ASTM E 562-05)
- This test method describes a systematic manual point counting procedure for statistically estimating the volume fraction of an
identifiable constituent or phase from sections through the microstructure by means of a point grid.
- After manually classifying the constituent at each computer-generated grid point, the software will calculate volume fraction automatically. This method is most often used to calculate residual Austenite and Ferrite volume ratio.
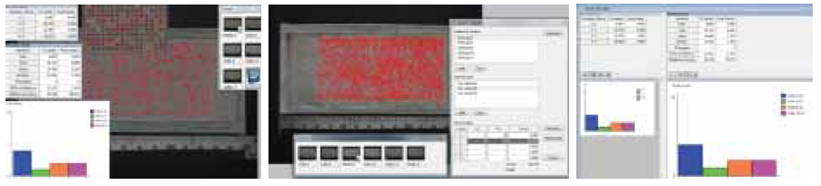
Rusting Degree Analysis (ASTM D 610-2008 and JIS H 8681-2:1999)
- This feature covers the evaluation of the degree of rusting on painted steel surfaces based on ASTM D610-2008. It provides a
standardized means for quantifying the amount and distribution of visible surface rust. JIS H 8681-2: 1999 is for asseement of the
corrosion resistance of anodic oxide coatings on aluminum and aluminum alloys based on JIS H 8681-2: 1999. Software also provides
customizable methods and tables with which user can create customized criteria. All user-created criteria can be password protected to prevent un-authorized changes.
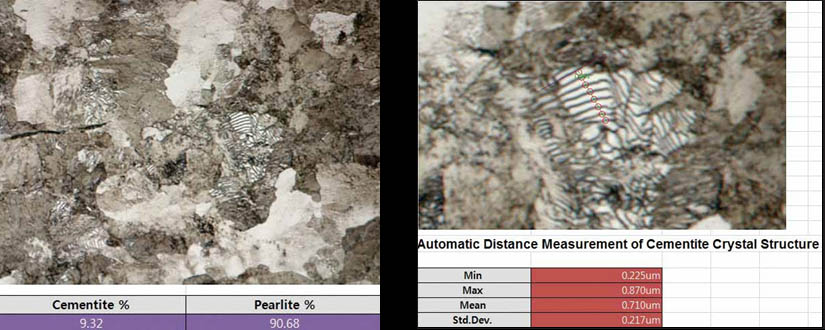
Cementite Crystal Structure Analysis
- Cementite volume Measurement :
Cementite and Pearlite Volume are measured to define the hardness and brittleness of materials.
- Automatic Distance Measurement of Cementite Crystal Structure :
Each distance in Cementite Crystal Structure is measured automatically.
Layer Depth Measurement
- Average, Min, Max, Standard Dev. thickness of width are measured automatically by simply defining a box shape region of interest. Up to 999 scan lines can be specified.
|
|