Filter contamination Quick-Scan TM
|
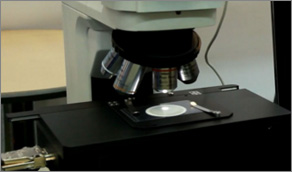
Filter contamination analysis based on ISO 4406 / ISO 4407 / ISO-DIS 16232-10 / SS 2687 Macro system System components: High resolution scanner + computer + DT-PA program 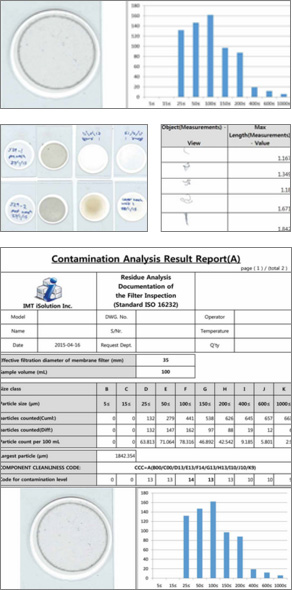 Micro system System components : Option1: High power upright or inverted microscope with polarized light(using stereomicroscope or zoom lens is not recommended for finding and measuring particles smaller than 100um) + Motorized control stage + computer + DT-PA program We recommend using Marzhauser, Prior Scientific, Ludl, and ASI stage. Option2: Stereomicroscope or Zoom lens with polarized light (recommended for finding larger size particles (over 100um) + Motorized control stage + computer + DT-PA program Option3: Stereomicroscope or Zoom lens with polarized light (recommended for finding larger size particles (over 100um) + Mechanical XY stage + computer + iSolution DT which includes a feature that enables the user to scan the entire filter with mechanical stage while the system automatically capture and saves a composite image of the filter for analysis. |
|||||||||||||||||
|
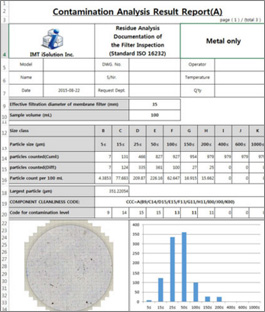
Filter contamination analysis based on ISO 4406 / ISO 4407 / ISO-DIS 16232-10 / SS 2687
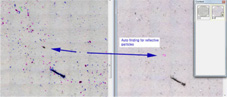
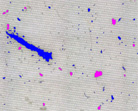
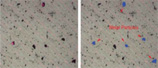
Automatic Detection of Metal Particles (Two different methods can be used selectively)
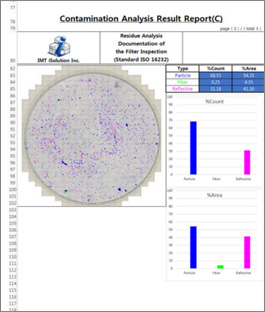
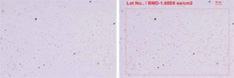
Customized Particle Analysis
Particle Shape and Size Analysis
|